
It is made possible to work with SAP Classical Debugger from within Eclipse. We don’t know whether this feature will sustain in long-term or not, however, it is present for now(for good).
This trick works for hard-coded breakpoint and should be used for Development environment!
Steps to be followed to use Classical debugger from Eclipse ADT:
- Right Click on Project in Project Explorer
- Click Properties
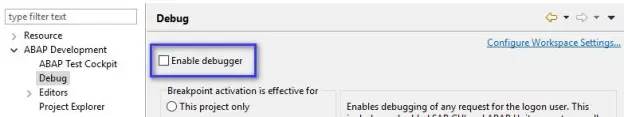
- Go to ABAP Development > Debug > Enable Debugger(Checkbox)
- Disable “Enable Debugger” Checkbox
- Open the code to be debugged and write a hard-coded breakpoint in code e.g. BREAK <sap_user_name> or BREAK-POINT(not recommended).
- Execute the Code/Transaction
- Classical ABAP Debugger will open in new window. Start debugging and enjoy good old days.
Tip: If classical debugger looks strange, try to maximize the classical debugger windows and/or rerun the application.